
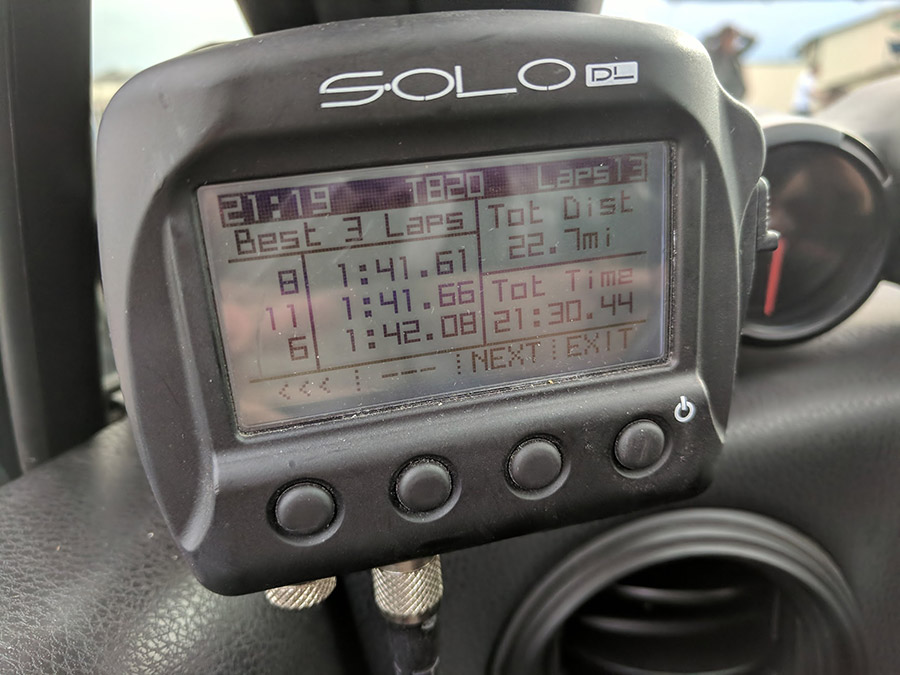
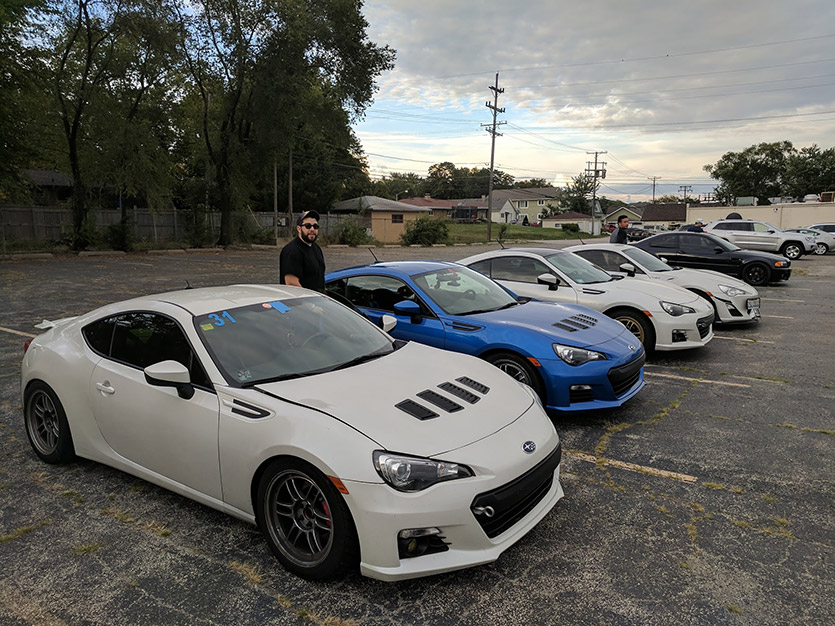
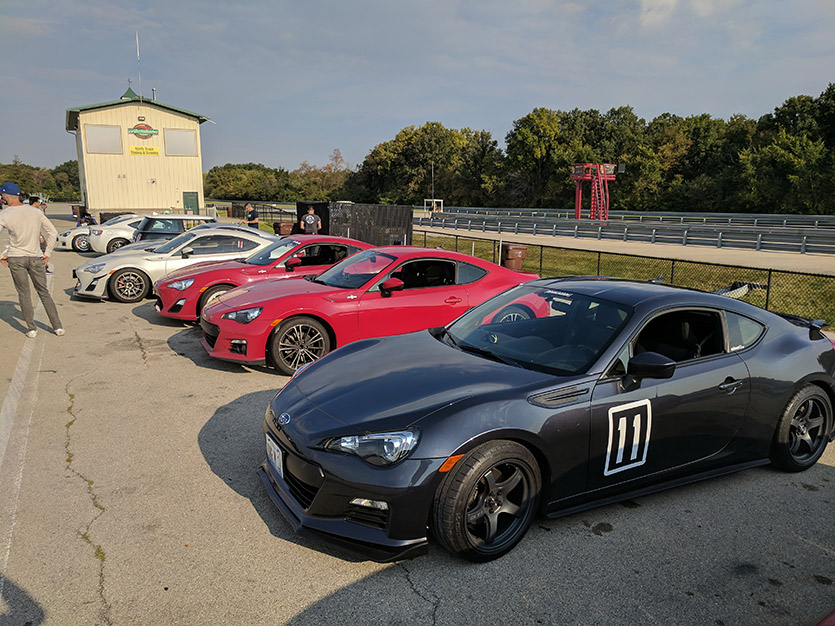
This is a tale of 4 dorks, 4 track day bros driving on the track with their 86s, and the data we collected. Taken at the GPS Track Time event on September 17th, 2017 at Autobahn South. Peter’s data taken from a very similar day the week prior on the 10th, and a little earlier in the day. All data take from AiM Solo and AIM Solo DL
; I would recommend the latter to get the fuller amount of data with OBD2 channel and additional gps coordinate logging.
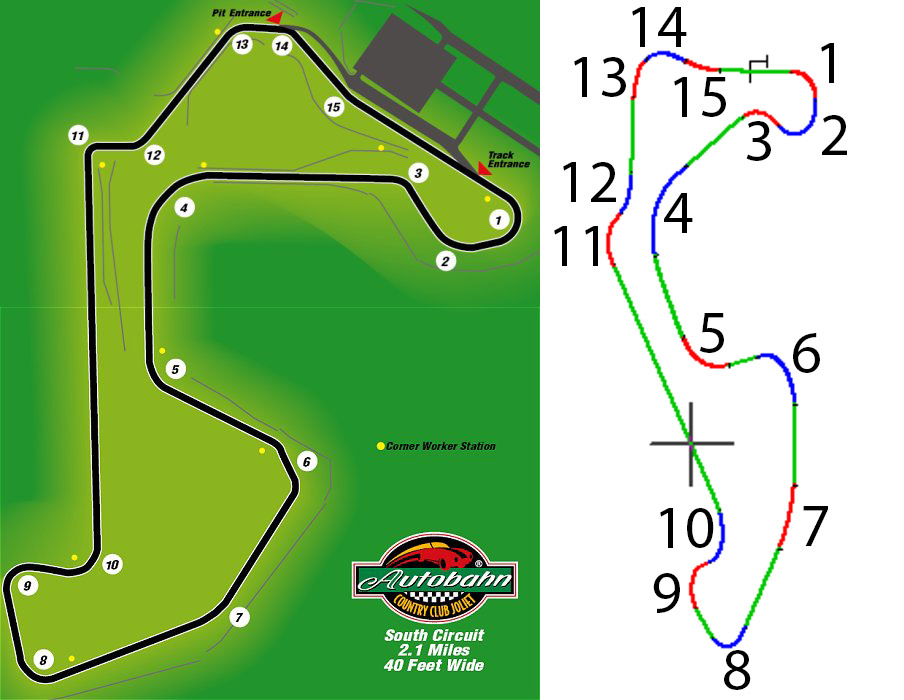
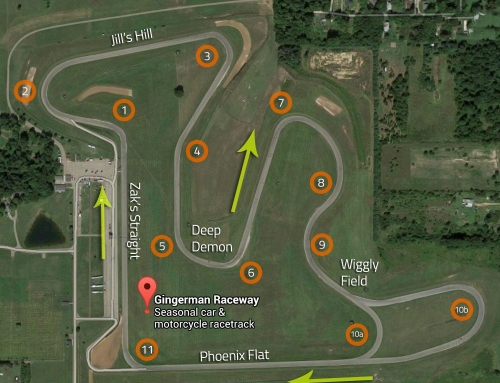
I’ve tried to break up the splits on the track similar to the actual track map.
Cars, with some recent dyno data:
| Name | tires | power | camber | color | fast lap |
| Peter | 215 RS4 | 174 whp / 143 tq | -2.5/-1 | Red | 1:42.609 |
| Mike | 225 DZ2* | 190 whp / 144 tq | -3.5/-2.3 | Blue | 1:41.613 |
| Tym (Mike’s car) | 225 DZ2* | 190 whp / 144 tq | -3.5/-2.3 | Green | 1:41.461 |
| Artie | 245 RE71r | 182 whp / 145 tq | -3.5/-2 | Black | 1:38.848 |
Tym was driving my car, I would have preferred more gently but he still wasn’t going for broke, and drives his own car more aggressively and has certainly hit lower times. However he has no Solo and the data recorded was from the Solo DL in my car. Unfortunately, I had a gopro which I thought was on for his session as well as the one with my personal best lap later – however the SD card was actually full in both cases with my prior slow driving for the day. D’ohp!
Here’s the results of the best rolling laps from AiM’s split report – it basically moves the start/finish line to the most advantageous split for a rolling connection of your best splits. This is a theoretical time you are capable of hitting, 99% of the time.
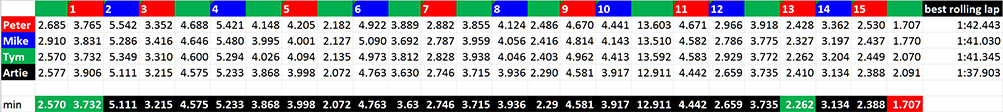
Artie is crushing it and certainly has a 1:37 in him. Speeds across the track are as follows:
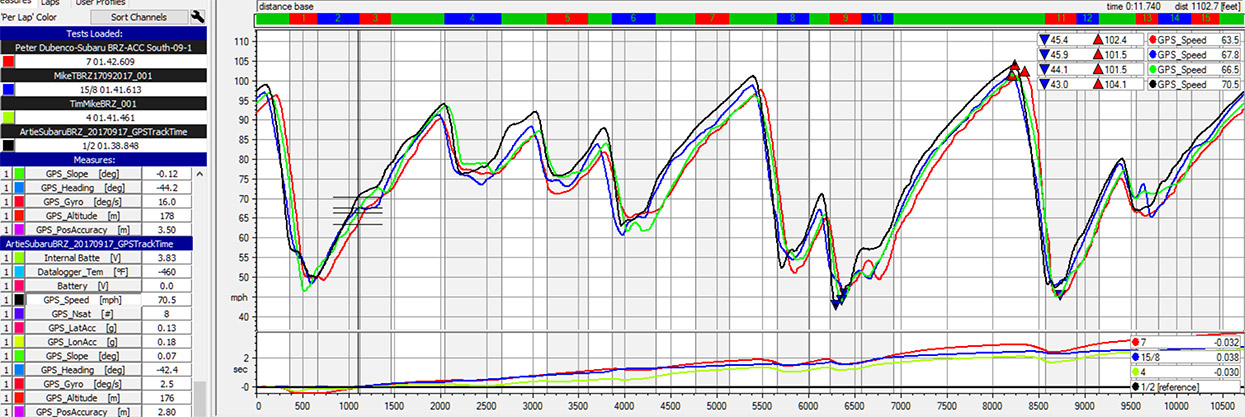
I’m still learning this software; this track map was built off of Artie’s best lap if I recall correctly. The graph above is GPS speed for the y-axis plotted across Artie’s lap on the x-axis by distance. Since we are taking slightly different lines and have different data ourselves, I’m not sure if braking before or after eachother, or even Artie, necessarily means anyone is braking earlier or later than Artie as their lines are likely different.
What can be compared pretty directly here is the slope of the changes in speed; the better slope upwards, the better the acceleration; the steeper the slow downwards, the harder/quicker the braking. We don’t have a ton more power than Peter, but generally our slopes upwards are better as we have at least a bit more power and acceleration on his car.
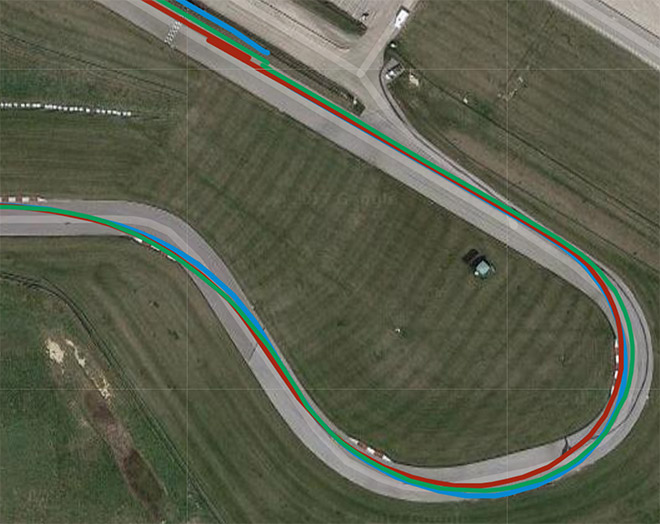
A map of our best laps via kml files on google maps. No lap for Artie as he has a Solo rather than a Solo DL. Since the kml is just gps data, I’m not sure why the regular Solo doesn’t log and provide this; but the regular Solo does not log latitude and longitude. How much can you really trust this as to matching your line? Eyeballing it I’m going to say… not as much as you can trust video…
Speaking of that, here’s a good in car view of Peter driving an almost entirely stock 86, chasing a Viper, and hitting his 1:42.6.
Turns 1 to 3
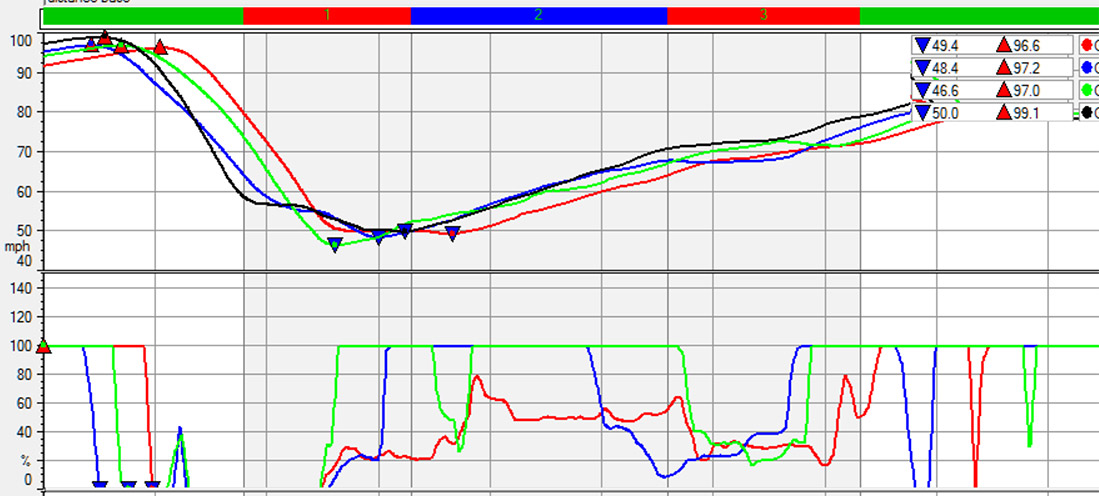
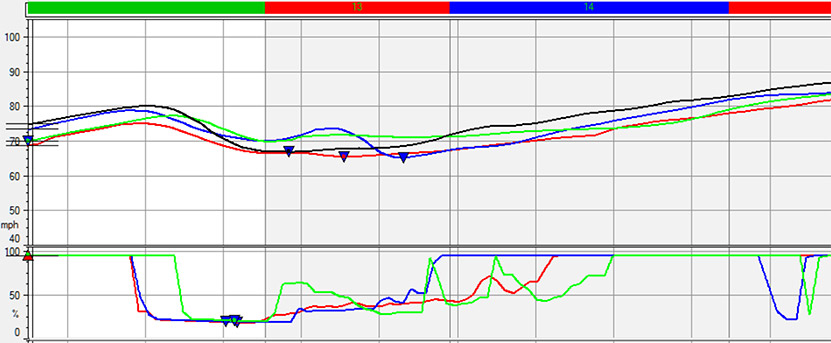
I’ve plot TOYO_PEDAL_POS, the % we are pushing the accelerator, down for the DL data as well. As noted earlier, I’m not sure how much the x-axis can be trusted as far as if someone is doing something any later earlier or later than someone else on the lap they actually drove. Among these 4 drivers, is it likely that I in blue started braking the earliest? I would say yes. Another interesting thing of note is Artie seems to clearly be outbraking us all on these laps heading into turn 1 as his speed descent is clearly the greatest.
I consider Tym and Peter to be faster drivers than me, and a surprising find – at least on these laps – is Artie and I braked to around the same point and did much of this split similarly after the braking. You can see Tym get on the throttle much earlier than me, and heading in to split 2 with more speed than anyone. Peter has much more partial throttle manipulation through these splits; there’s probably a lot of explanations one could come up for this. Perhaps he is managing the limit of grip with his skinnier tires and stock suspension here, whereas I am not and as a result can go full throttle myself. Or perhaps Peter is managing throttle more gently than need be and could go full throttle. As our cars are so low on power it’s much harder to get into trouble goosing the car with too much throttle like it would be on something like a ZR1, so that may certainly be the case. AAT (Ambient temps) for Peter’s lap appear to be from earlier in the day, as it was 61 degrees (f) out, whereas it was 72/73 for Tym and I’s laps – certainly Peter was also managing with less grip in cooler track conditions then as well.
Heading through split 2 to turn and split 3, I lift the most and the earliest. Whereas I was matching Artie through a lot of split 2, I give up speed the earliest and have the lowest appearing apex speed for turn 3; although later I’m the earliest back on the throttle heading out of the split and onto the straight. From the throttle on the straight it looks like I took the longest to shift gears, and it looks like Tym did not fully let off. Be nice to my car Tym!
Turns 4 and 5
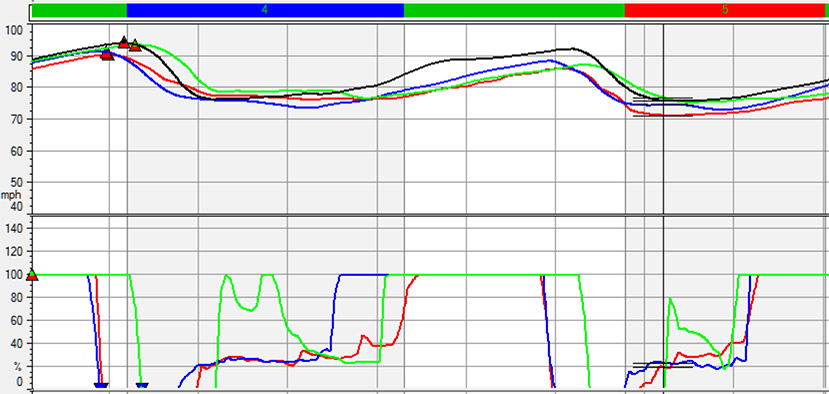
These are the fastest turns on the track. I know if I’m a little skerred that I’m probably turning a decent lap. Although, as seen in the blue, I’m taking the fastest (turn 4) slower than everybody else. No excuse for that as Tym is clearly taking it faster in my very same car. It again looks like Artie is doing the hardest braking. Artie is flying and accelerating hard on exit. Since his speed hits nearly as low as mine, I can only assume he’s on the gas much earlier than any of us. Peter and I look to braking very similarly for 5.
Turns 6 and 7
One guess as to who is braking champion again? Once again Artie cuts deep, and I seem early. Mid turn we are all pretty much the same speed, although for these laps I was on the gas early. Not enough speed through the corner or gas earlier enough to keep up with Artie, however. On the straight once again, it appears that my slow shifting can be observed by the throttle position. Turn 7 isn’t much of a real turn, just a kink in the side of the road.
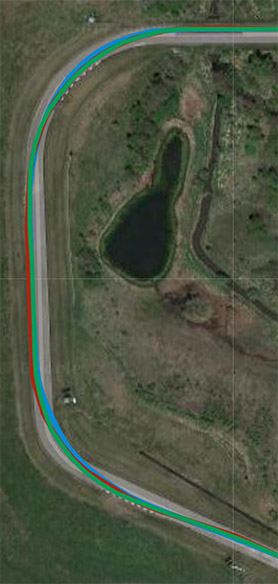
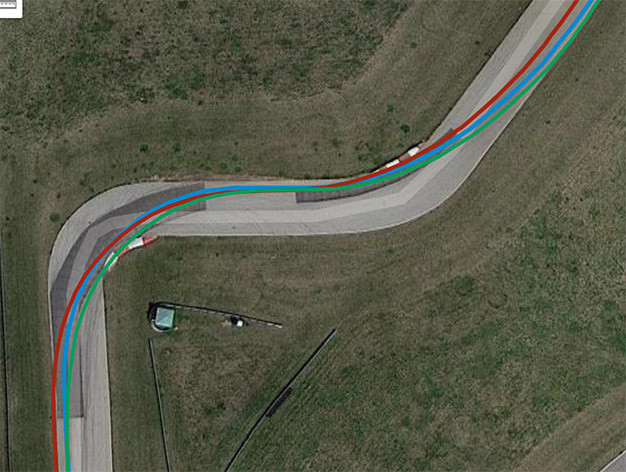
Turns 8 to 10

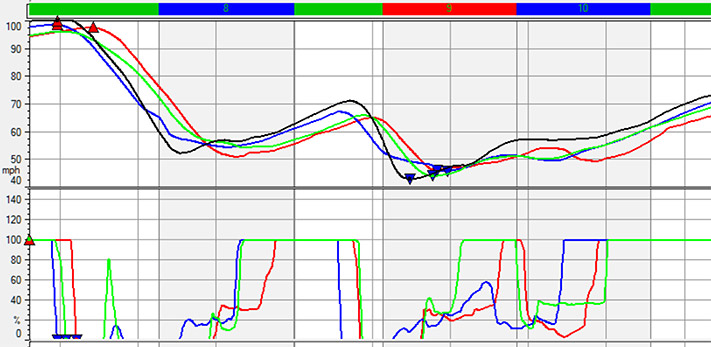
Turns 8 and 9 slow you down a lot, particularly turn 9 “patience” – it’s a tight turn right before a major straight. I think the google map line here is relatively accurate, as Tym and I are on the right side of the track heading into turn 10 and the long straight; one of Peter’s students told me that Peter’s line was taking it down the middle and that he is picking up some time there. That’s definitely how it appears in the map.
If the x-axis is to be trusted, Artie and I braked similarly to start here, but his braking is hardest once again. Although entering the turn the slowest, he’s again on the power earliest and leaving the fastest. Tym and I got on the power very similarly yet I left 8 much faster. How to explain this in the same car? I didn’t plot it, but at that start point my steering angle was 77 degrees while Tym was 101. This was the same throughout, I always had less steering input through split 8 which allowed me to accelerate more quickly.
Artie brakes hardest for 9 and is entering slowest again as well. We’re at similar speeds around apex but Artie is speeding right on through it. It looks like he carries this with maintenance throttle and gets full back on the gas at the apex of 10 and leaves us all.
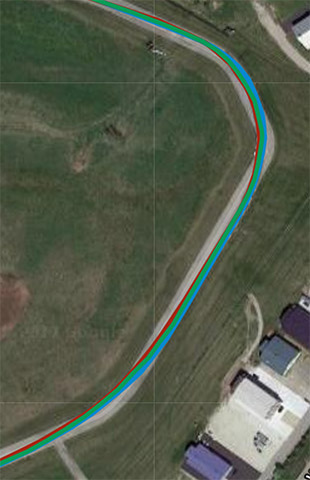
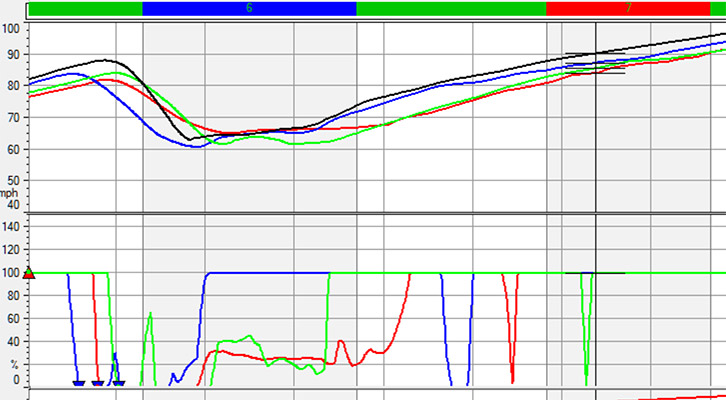
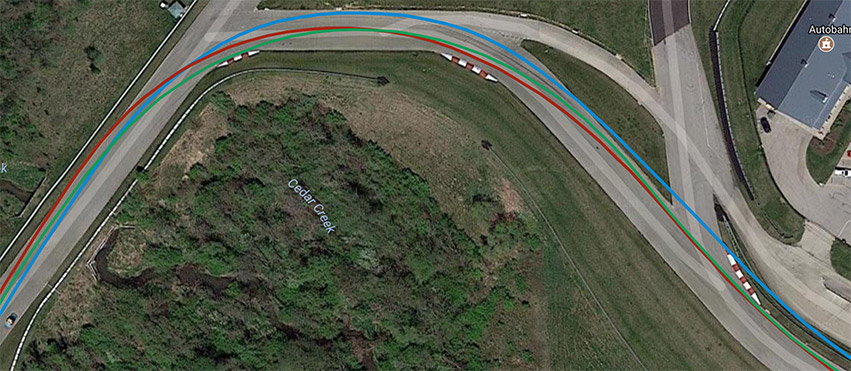
Turns 11 and 12
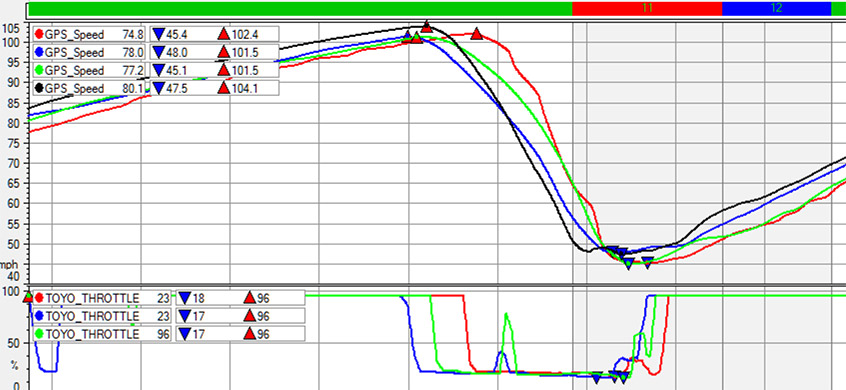
This is the fastest straight on the track, going into a tight turn 11. Typically you brake hard and run over at least some of the berm on the right to cut this turn. I think I botch this up all the time and end up doing sloppy late understeers a lot. It’s not smooth looking, but it looks like Peter is braking later and harder than Artie in this instance. Artie has the highest straight speed by far.
In the turn, Artie and I look similar speed wise, although he must be on the power earlier to run out more quickly. Tym and Peter look pretty similar in this one; although Tym was initially carrying more speed they became very even after that. It looks like again steering input may have been the reason why.
If the google line is to be trusted, Tym caught the most berm, and Peter seems to taken an exist for 11 closer to the center of the track rather than tracking out further right.
Turns 13 to 15
At least my line on the google map here is broken, as I didn’t go off rallying through the grass on this turn. 13-14 is generally taken as one big smooth turn. Some people try to apex both, I personally try to brake a little for 13, stay a car length off it, get on the gas as soon as possible/comfortable and apex 14. 15 is just a little kink onto the straight.
It looks like Peter and I let off the gas around the same place, Tym later of us all. The Artie deep brake in effect, him and Peter enter the split similarly, Tym and I at a higher speed, and Tym’s doesn’t waiver as mine declines. Tym and I both make it through this split more quickly than Artie. I started before and kept constant throttle through split 14, and second only to Artie. A combination of Artie getting on even earlier than me in 13 and my dip in speed in 13 have Artie shooting through 14 even more quickly. My maintenance throttle in 13 looks decent, so why the dip? Checking steering angle, I have a lot more input than Peter or Tym here. In the middle of my dip, I’m at 78 degrees – Peter and Tym are at 53 and 50 respectively. They’re spending their power accelerating whereas I’m spending mine turning. Out we go onto split 15 where I have another of my famously slow shifts. 🙂
Other Interesting Things in the Data
Since we’ve got it here, what other cool things we can see in the data? We can see how the Forester oil cooler for the brz frs is working, as both Peter and I have them.
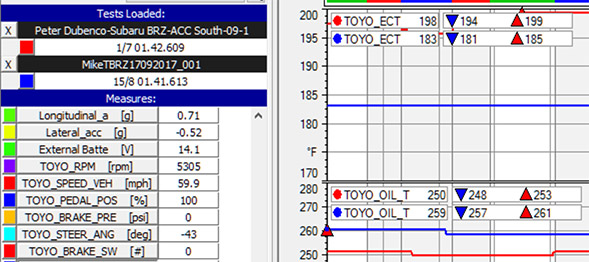
These temperatures are pretty in line with what we normally see. No cooler you’ll get up to 280+ beyond a novice skill level on a typical track. My temperatures are likely warmer than Peter’s here as it’s a warmer part of the day, it could also be further into the session. Coolant temperatures are both within good ranges, Peter is running the stock radiator whereas I have the Koyo radiator.
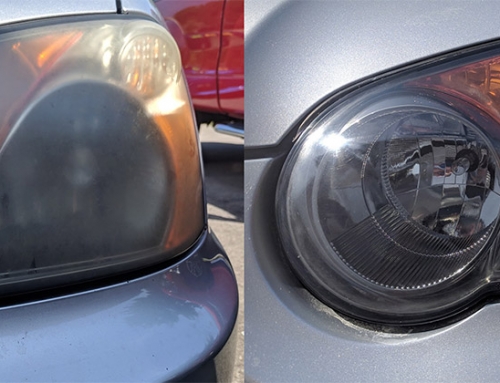
How about the intake? I have a Zeek snorkel and Airaid intake intake. Do I think that a CAI is going to do anything for you on the street or give you more power? No. Do I think it’s possible to swap intakes and find better/worse air intake temps on the street, or particularly where it matters, after 10 minutes of track driving? Yes. Here is my combo vs. OEM and the difference in ambient vs. intake temperatures.
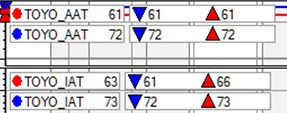
Here we can see the OEM intake sucking in air up to 5 degrees above ambient on Peter’s lap, whereas mine is up to 1 degree above ambient. The snorkel and intake are doing their work. How much hp is the cooler, more oxygen dense air really giving you? Realistically probably only a few hp, but I’ll take all that I can get in this car!
You can collect data in other acquisition systems, however this one is pretty popular and comes with the tool above to analyze and compare the data – something very useful and not easily done within those other systems. So I would highly advise anyone interested in this kind of thing to look at the AiM products like the Solo and Solo DL, the latter of which I think is certainly worth it to capture the richer OBD2 data set. The data can also be exported out to render on top of video as well.
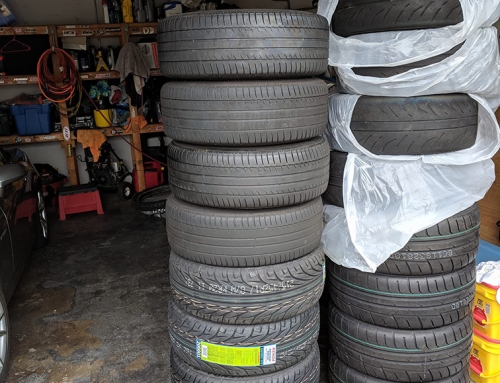
what are the aspect ratios and diameters of the tires used?
215/45, 225/45, 245/40 – all 17s
Hi I just read your post. Detailed write-up. Looks like you spent some time on it. I was hoping to fiddle with some data files from Aim Solo & SoloDL to check it out. Found some files here: https://www.pointmeby.com/about-us/ near the bottom of the page.
But it appears the files are just the .drk files and therefore don’t have any GPS Latitude or Longitude coordinates included. Did you not include that data in your zip for a reason? I have read that the GPS data is inside the .gpk file and require that file to see GPS postions on a trackt –> .drk, .rrk and the .gpk
Just curious if you will post those at some point in time or not?
thanks don! i think those are out of date for our best laps now, but you should be able to open the .drk file with the free race studio software. the .drk does contain lat/long, as well as all the other data, from the aim solo dl. the aim solo however does not actually log those values so it will not be in there. there is a separate gpk, although we never pass this one around. iirc i exported my data from the .drk to .kml from race studio to graph in google and mage the above images, and did so with a single lap. i assume plotting the gpk for full sessions would look a lot messier on an overlay.